Body Mass Indices
Body indices for evaluating the body's weight
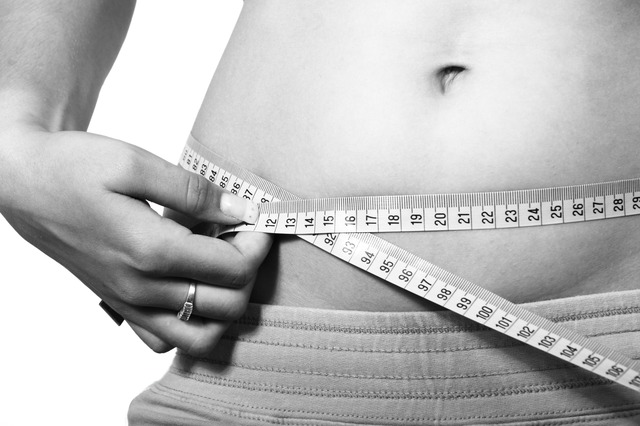
To determine whether a body schema deviates from the norm or also carries a health risk, various body indices have been developed. The aim of these indices is to set the body weight in relation to stature, since the weight alone is not meaningful. A person with a larger body size e.g. can not be overweight even with a higher weight while a smaller person is already overweight. Another key factor is the ratio of muscle mass to fat. Both gender and training status play a role here. Since women generally have lower muscle mass, sex must be considered when interpreting the indices.
What can the body indices do?
The body indices can give an indication as to whether overweight or underweight or whether there is a health risk. Furthermore, they can make statements about the training level. It should always be noted that the indices give only one indication. It is always a great simplification that tries to deduce the fat and muscle parts from easily determined data.
Which body indices are there?
The indices use different input quantities to deduce the body schema. The simplest ones use only weight and height. These include the Ponderal Index, the Broca Index, the Area Mass Index and the widely used Body Mass Index BMI.
An essential extension is the Body Shape Index (ABSI), because it includes the waist circumference as an essential factor in the consideration. The waist circumference is a good indicator of body fat distribution. The weight itself says nothing about whether the weight is in the form of muscle or in the form of abdominal fat or subcutaneous fat.
Other ratios provide the ratio of size to waist circumference (WHtR: Waist - Height Ratio) and the ratio of waist to hip circumference (WHR: Waist - hip ratio).
One important index for assessing exercise status is the FFMI. The Fat Free Mass Index (FFMI) is an index of how weight comes about through muscle or fat. The FFMI is more meaningful here, as it takes into account the body fat percentage. A high FFMI signals a good state of training so a high muscle content.
Calculator for calculating body indices
On this page are computers to the widespread indices, which calculate the respective index and partially for ease of interpretation also graphically represent. Because the indexes may deliver quite different results, the body indices calculator calculates and compares all indices in parallel. The body indices calculator calculates and rates the following body measures: Body Mass Index (BMI), Broca Index, Ponderal Index, A Body Shape Index (BSI, ABSI), Waist-to-Size Ratio (WHtR)), Waist-to-Hip Ratio (WHR).
Body Mass Index (BMI)
The body mass index (BMI) is a measure that sets the weight in relation to the square of the body size. The BMI is a rough guideline because it covers neither stature nor weight distribution. Since the early 1980s, the BMI is also used by the World Health Organization. The current BMI classification of the WHO exists essentially since 1995.
How to calculate the BMI?
The BMI is calculated by dividing the body weight by the square of the height.
mit m : body weight in kg, L : height in m
Example for the calculation of the BMI
For example, if a person is 1.75m tall and weighs 65kg, then the BMI is calculated as follows:
With the BMI calculator , the BMI can be easily calculated by entering size and weight.
What does the BMI tell me?
The interpretation of the calculated BMI value is based on the comparison with the tabulated average values of the population. That the normal range corresponds to the average in the population at the time of the survey. The BMI can also be used in children and infants as a measure of the healthy development of the child. The BMI is calculated according to the same formula as the adult BMI, but is interpreted according to age. From the BMI Tables it can be seen in which range from a strong underweight to a strong overweight the determined BMI lies. The tables differ for men and women. For adults, the values are valid from 19 years and for children and adolescents, the appropriate age-appropriate value.
If the person from the example is a female teenager at the age of 16, then the table for women shows a BMI of 21.2 in the normal range.
Age
strong underweight
underweight
normal weight
overweight
strong overweight
16 Years
BMI < 16.3
16.3 < BMI < 18.3
18.3 < BMI < 24.3
24.3 < BMI < 29.1
29.1 < BMI
BMI progress for infants
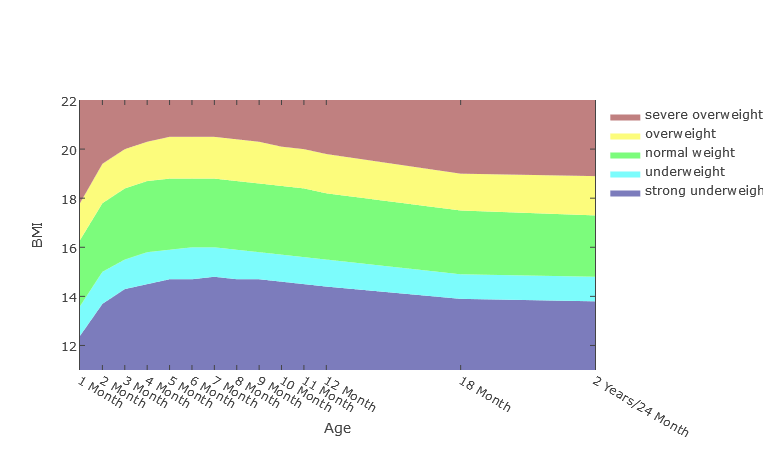
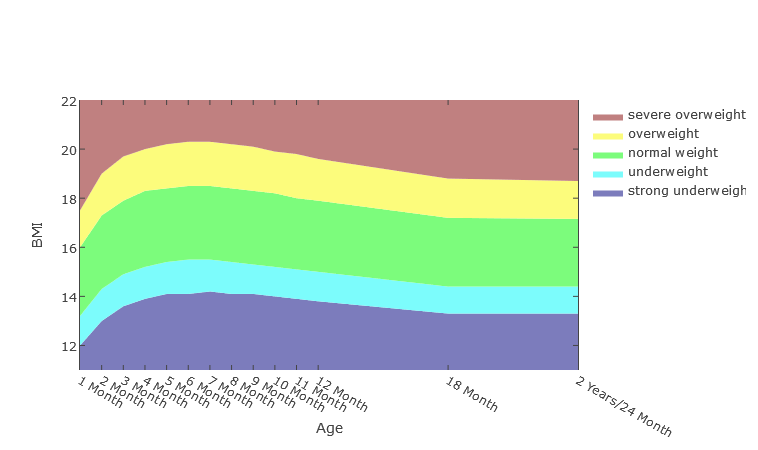
The diagrams show the progression of BMI areas for toddlers aged up to 2 years.
Boys
Girls
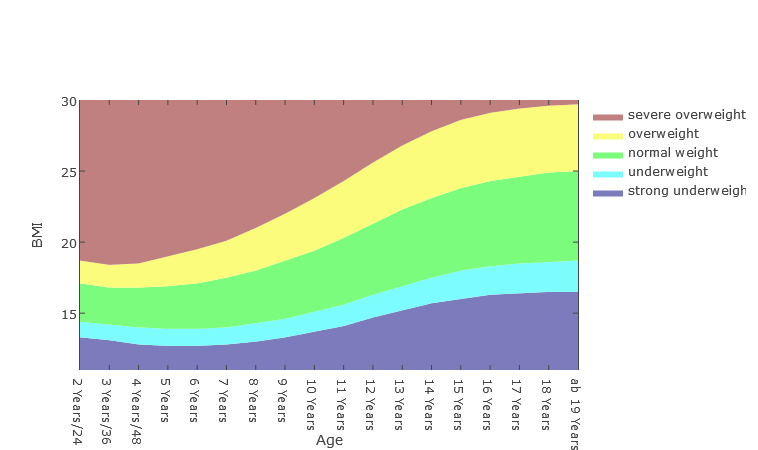
BMI progress for children and adolescents
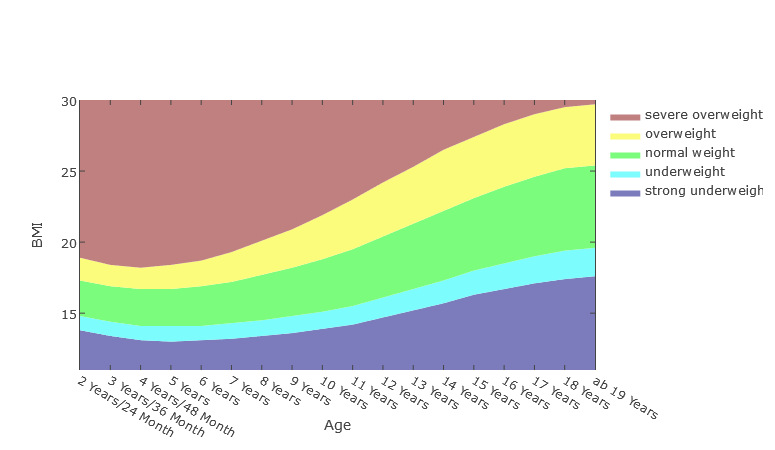
The diagram shows the progression of BMI areas for children and adolescents aged 2 to 18 years.
Boys
Girls
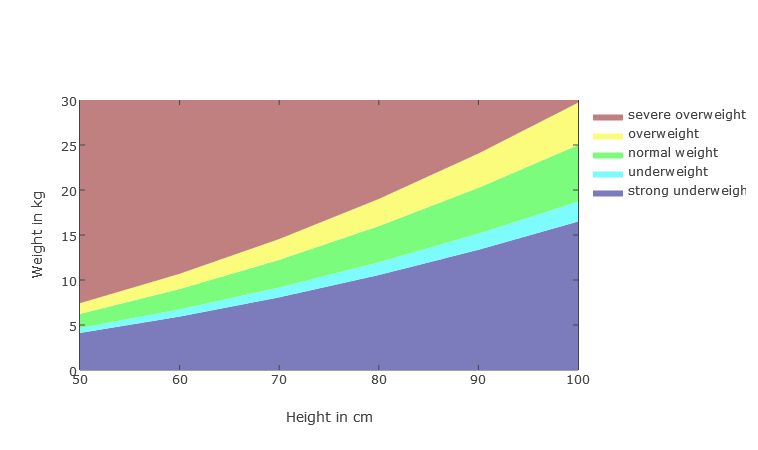
BMI progress in weight to height chart
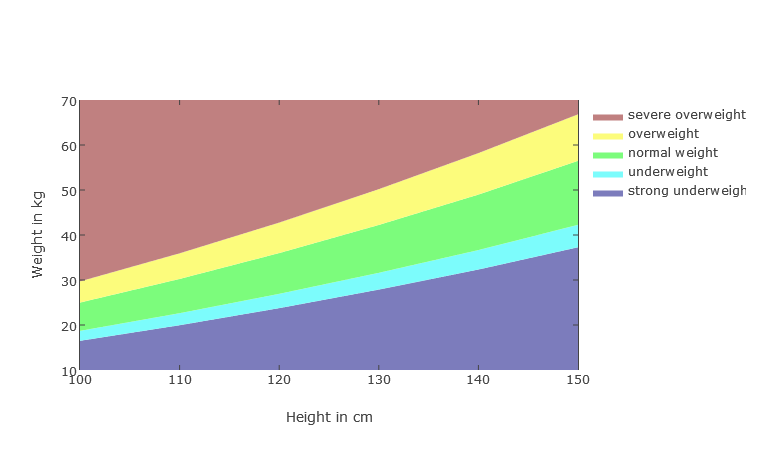
Due to the different growth in children, the height-to-weight ratio may make more sense. But also in general it is interesting to consider the BMI in terms of size. The question of which BMI and which size is answered by the BMI weight over size diagram . The diagram shows the progression of BMI ranges in relation to height to body weight. The BMI Calculator also shows the weight limits at the given size in the graphical classification of the result.
Boys 50 - 100cm
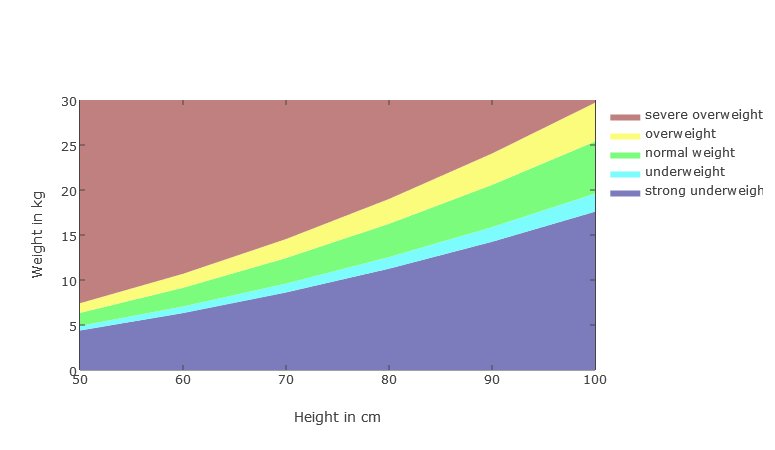
Girls 50 - 100cm
Boys 100 - 150cm
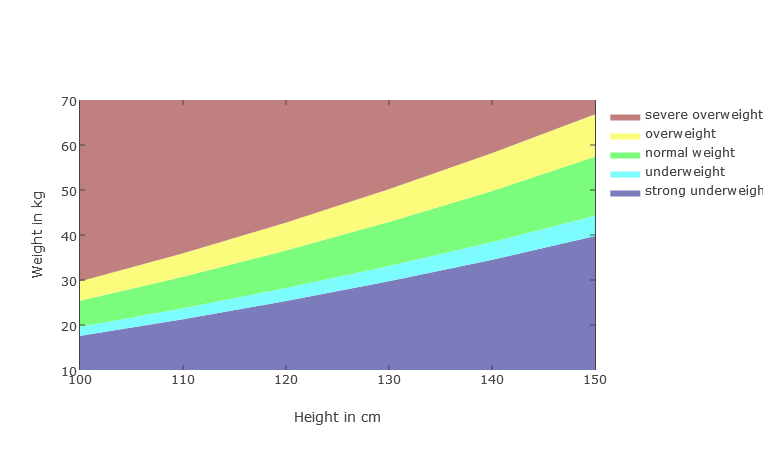
Girls 100 - 150cm
Ponderal Index (PI)
The Ponderal Index is a measure of body weight relative to body size, similar to the body mass index. In contrast to this, however, the weight is divided by the third power of the body size, that is, based on one volume. Ponderal Index values between 11 and 14 kg/m3 are considered normal.
Ponderal CalculatorHow to calculate the Ponderal Index?
with m : Body Weight in kg, L : Body Height in m
Example for the calculation of the Ponderal Index
For example, if a person is 1.75m tall and weighs 65kg then the ponderal index is calculated as follows:
Thus, the value in the example is in the normal range.
Broca Index (BI)
The Broca Index is a measure of the normal weight of a person. It was developed by Paul Broca, a French physician, surgeon and anthropologist (1824-1880). The Broca formula for the ideal weight of women is: height in centimeters minus 100 and subtract 15 percent from the result. The Broca formula for the ideal weight of men is: height in centimeters minus 100 and subtract 10 percent from the result. The Broca index only allows a rough assessment and is best for the mid-height range.
Broca CalculatorHow to calculate the Broca Index?
Die Broca-Formel für das Normalweight lautet: Körpergröße in Zentimetern minus 100 ergibt das Normalweight in kg.
with L : Body Height in cm
Example for the calculation of the Broca Index
For example, if a person is 1.75m tall then the normal weight is calculated as follows:
That the normal weight is 75kg. For the ideal weight must be deducted with a man 10% so 7.5kg. Thus, the ideal weight is when the example is a man 67.5kg. For a woman, 15% must be deducted according to 11.25kg. Thus, the ideal weight for a woman is then 63.75kg.
Comparison of BMI, Ponderal Index and Broca Index
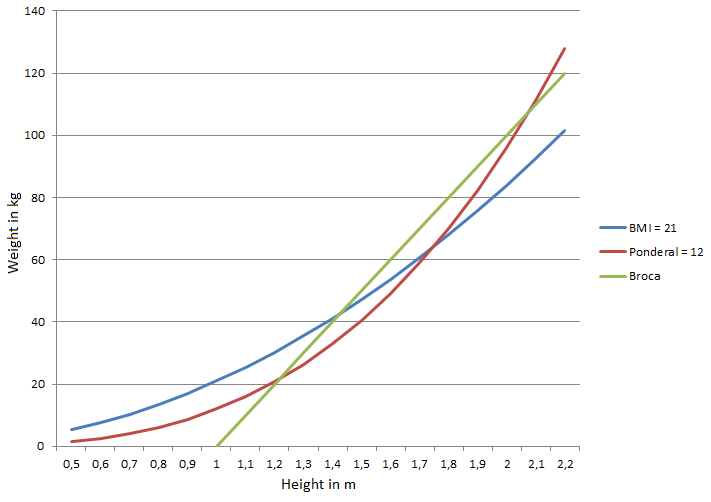
The diagram shows the course of BMI, Ponderal and Broca Index in the relation of size to weight. For average sizes in the range 1.70 m to 1.80 m, the indices are close to each other. However, the difference between volume and area makes a significant difference for tall and short people.
Body Shape Index (BSI oder ABSI)
The Body Shape Index (ABSI) says something about the body sheer division. The higher the ABSI, the higher the proportion of abdominal fat compared to other body parts such as musculature or under-skin fat on arms, legs or upper body.
with U : Waist Size in m, L : Body Height in m and the BMI : Body Mass Index
The risk index ADSIz is calculated using the empirically determined table values for the ABSI for men and women.
with the indices mean : Average and std : Standard Deviation
Area Mass Index (AMI)
The area mass index (AMI) is a characteristic of anthropometry and represents the ratio of the body mass of a person measured in kilograms (kg) to its actual body surface measured in m², And the sex of a person. The body surface of a person is at the same time the area of his heat exchange with the environment. The heat generation of man, which is necessary for the maintenance of the body temperature, depends on the mass, or rather, on the mass of the muscle. The ratio of body mass to body surface is not constant but is determined by the body shape. Impacted bodies always have a much smaller body surface area per kg body mass than lean body shapes. To this extent, lean body shapes give considerably more energy in the form of heat to the environment than compact ones, provided that the conditions of the heat exchange (ambient temperature, insulation by clothing, etc.) are identical.
AMI for Woman:
AMI for Man:
with m : Body Weight in kg, L : Body Height in m
Waist-to-Height Ratio (WHtR)
WHtR (waist-to-height ratio) is the ratio between waist circumference and body size. It is to make a statement about the distribution of the body fat and thus allow a greater meaningful weight regarding the health relevance of overweight. For under-40s, a value above 0.5 is critical. Between 40 and 50, the liwith is between 0.5 and 0.6, and over 50 is 0.6.
with U : Waist Size , L : Body Height
Waist-to-Hip Ratio (WHR)
The Waist-Hip Ratio (Waist-to-Hip Ratio) (WHR) ratio is the ratio between waist and hip circumference. In sports medicine, the quotient of the circumference of the abdomen and hip circumference is also referred to as HBU. The circumference of the belly is measured in the middle between the pelvic crest and the ribs parallel to the floor. The hip circumference is the greatest measure above the buttocks. The DGSP provides the following values for the HBU in the guideline Precautionary Survey in Sport: Women: Normal weight < 0.8; Overweight 0.8-0.84; Obesity > 0.85. Men: Normal weight < 0.9; Overweight 0.9-0.99; Obesity > 1.0
with U : Waist Size , H : Waist Circumference
Body Fat
The body fat part can be calculated using the Navy method and the YMCA method. The methods also calculate a rough estimate of body fat percentage and calculate the fat free mass index.
Units are cm and kg
FFMI
Formulas for the calculation of FFM and FFMI.
Units are Body fat in percent, height in m and weight in kg
Measurements
Neck size
Wrap the measuring tape around the neck, beginning at about one inch from the meeting of your neck and shoulders. This may also coincide with the bottom part of your Adam's apple. Come fully around the neck, leaving no dangling space in between the neck and the tape. Don't pull too tightly so as to create unnecessary tension, just enough so that you are getting a true measurement. Make sure the tape is level and not being held at an angle.
Waist size
Find the top of your hip bone and the bottom of your ribs. Breathe out normally. Place the tape measure midway between these points and wrap it around your waist.
Hip size
Your natural waist is the smallest part of your torso, where your body dips in. Your hips are below that, and they are usually wider than your waist. Your hip measurement includes your butt and your hips. Your hip measurements should be taken at where your hips are the widest. That's because when you're taking measurements, you're trying to get an accurate representation of your body, and the hips represent the widest point on your bottom half.
Body Indices
Calculator for the Body IndicesThe Calculator for the Body Indices computes the following indices:
- Body Mass Index (BMI)
- Broca Index
- Ponderal Index
- A Body Shape Index (BSI, ABSI)
- Waist-to-Height Ratio (WHtR))
- Waist-to-Hip Ratio (WHR)
Basic consumption, Performance consumption und Sports consumption
The entire energy conversion consists of several components. The basic conversion describes the energy expenditure to maintain body temperature and basic body functions. In addition, there is the performance turnover reflecting the expenditure on activities and the sports turnover.
Reduced mass for a BMI from 30 kg/m2
with mr : Reduced Body Weight in kg, m : Body Weight in kg, L : Body Height in cm
Basic consumption GU
with GU : Basic consumption in kcal, m : Body Weight in kg, L : Body Height in cm, a : Age in years, s specific gender value s= 5 Man and s= -161 Woman
Performance consumption LU
with LU : Performance consumption in kcal, GU : Basic consumption in kcal, PAL : PAL-Factor for the activity, h : Duration of the activity in hours
Sportumsatz SU
with SU : Sports consumption in kcal, MET : MET-Factor for the activity, h : Duration of the activity in hours, m : Body Weight in kg
Total consumption GG
Body Mass Calculators
Here is a list of calculators with which it is easy to calculate the corresponding body indices:
Calculator for the Body Indices BSI Calculator BMI Calculator AMI Calculator Broca Calculator Ponderal Calculator Body fat and FFMI WHtR Calculator WHR Calculator